A replacement pump may have a smaller motor or parts that are easier to reach. Those features are worth reviewing, but they do not tell you how much electricity, leaked product or discarded material the installation will produce.
Start with the existing duty: what liquid is being moved, how much is delivered, and at what pressure? Then compare electricity readings, leakage events and service records. Those are the records that let you check whether an expected improvement actually happened.
| Record | Include in the site log |
|---|---|
| Operating basis | Reporting dates, liquid and temperature, delivered volume, inlet/outlet pressures, and operating hours. |
| Electricity | Metered kWh for the period, equipment covered by the meter, and whether any figures are estimated. |
| Leakage | Date, source, liquid, measured or estimated quantity, containment, and cleanup materials. |
| Maintenance waste | Parts and quantities replaced, reason for replacement, cleaning materials, and recorded disposal route. |
Copy these headings into your log. Mark unavailable data rather than entering zero, and use the same scope for each pump being compared.
1. Compare kWh per Delivered Volume
Read the electricity meter and delivered-volume total over the same period. Divide kWh by m³ delivered to calculate energy per unit of output. Keep the liquid, temperature, required pressure and duty pattern comparable; the ratio will not explain a change in those conditions for you.
A motor nameplate gives rated power, not metered consumption. State whether your meter covers the pump drive alone or also controls and auxiliaries. Record changes to pipework, control settings or production schedules alongside the readings.
| Record | Period A | Period B |
|---|---|---|
| Electricity | 4,500 kWh | 4,800 kWh |
| Delivered volume | 7,500 m³ | 9,600 m³ |
| kWh per m³ | 0.60 kWh/m³ | 0.50 kWh/m³ |
Assume comparable liquid, pressure, duty pattern and meter scope. These are illustrative values, not YANESS test data or a savings claim.
Period B uses more electricity in total but less per cubic metre delivered. Looking only at the monthly kWh would miss that difference. To establish why the ratio changed, check the duty and operating records rather than attributing it to the pump alone.
The pump-system lifecycle cost guide (PDF), published through the U.S. Department of Energy, also explains why energy comparisons need the operating pattern of the whole system.
2. Count the Leak and the Cleanup
For each leak, record the date, source, liquid, duration and quantity where you can measure or estimate it. Add the containment and cleanup used. A few contained drips and a spill outside containment need different entries, even if each counts as one incident.
Review the seal arrangement, inspection access and collection provisions for the liquid being handled. An indicator or drain opening helps reveal a leak; the site still needs an appropriate way to collect it and investigate the cause.
3. Record the Parts and Materials Discarded
List the parts replaced at each service event, their quantity or mass where available, and the reason for replacement. Include cleaning liquid, absorbents and discarded gaskets. Separate worn parts from parts replaced as a precaution or damaged during removal.
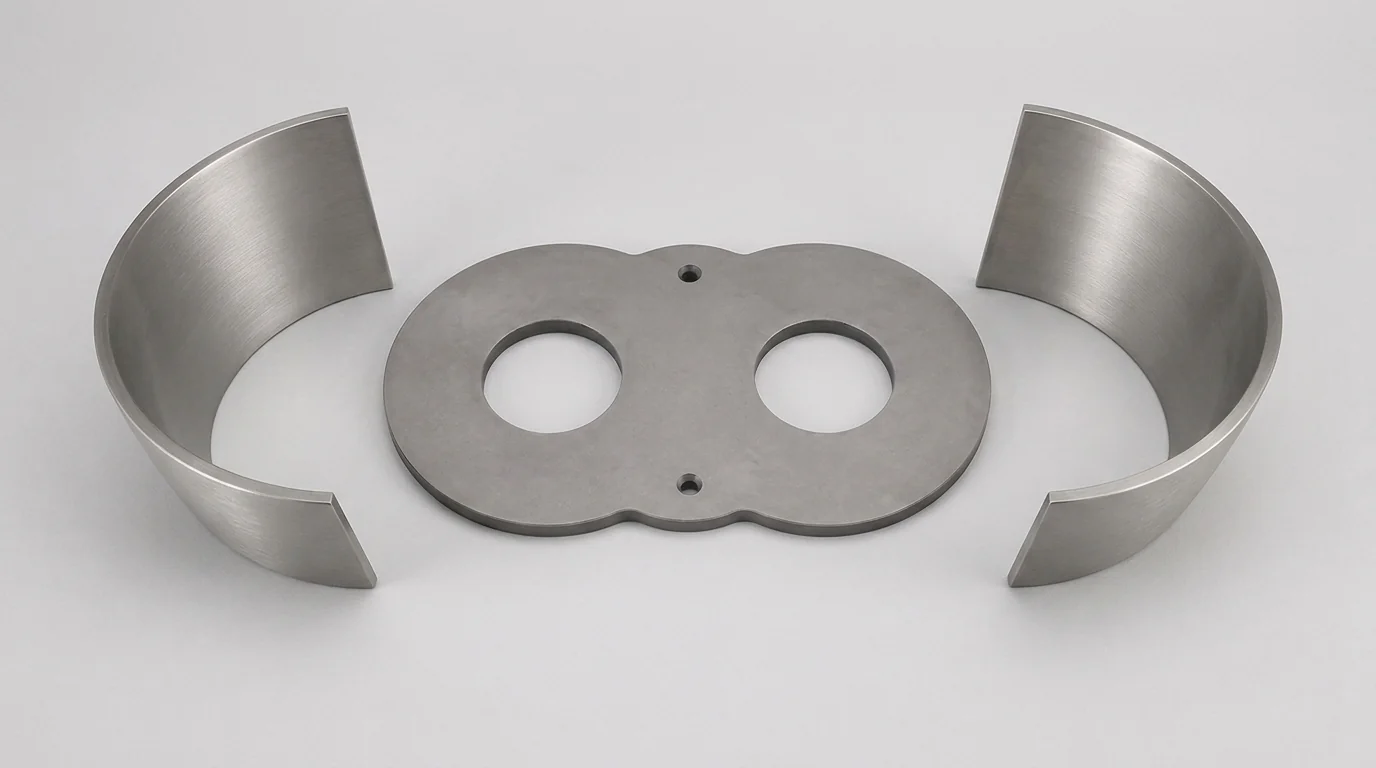
Front access and replaceable wear surfaces can change the service task. Check what the installed layout actually allows: which connections are opened, what needs cleaning, and which components can remain in service. Compare the resulting work and discarded materials over similar operating exposure.
For the access and service-work side of the comparison, see Maintenance Access and Pump Lifecycle Cost.
4. Investigate Early Replacement
If rotors, seals or liners are being replaced early, preserve the removed parts or take clear photos before disposal. Record the fluid, concentration, solids, temperatures, cleaning agents and shutdown conditions. Ask whether the proposed material grade or elastomer compound suits that full exposure.
Compare replacement frequency over similar hours and service conditions. A higher-priced compound is not automatically a longer-lasting one, and a materials change may not address a problem caused by the inlet arrangement or operating practice.
The materials guide lists the process information to check before agreeing a wet-end specification.
5. Keep the Environmental Claim within the Evidence
The records above describe operation and maintenance. A full lifecycle assessment also needs data on material production, manufacturing, transport and end-of-life treatment. Define the comparison period, useful output and included equipment before describing the result as an environmental improvement.
Keep electricity, leaked liquid and waste quantities separate. Less electricity alongside more frequent parts replacement is a trade-off to examine. To turn kWh into an emissions estimate, state the electricity emissions factor, its source and reporting period, and the calculation scope; kWh alone is not a carbon footprint.
For the framework of a formal lifecycle assessment, see the ISO 14040 overview. The site log in this article is an operating comparison, not a complete LCA.
6. Give Suppliers the Same Baseline
Give each supplier the same liquid, flow, pressure and operating schedule, plus the energy and maintenance records you have. Ask for the basis of estimated power, expected service intervals and replacement parts. Mark unavailable figures as unknown rather than zero.
First confirm that the proposed pump meets the transfer duty. Then compare its operating costs and service requirements with the other suitable options. After installation, use the same meter scope and record headings to check the outcome.
If you are still choosing the pump type, see When a Rotary Lobe Pump Is the Wrong Pump Choice for the operating requirements to check first.